Impact on population mobility
Large scale analysis of mobility data and language during the COVID19 pandemic
Impact of COVID-19 on Population Mobility
To study how population mobility varied across regions and within each region during the pandemic, we utilized a dataset released by Facebook in the context of the Data For Good program. The data is collected directly from mobile phones of users over 18 years of age that have the Facebook application installed, and the Location History setting enabled. In the case of France, each region corresponds to a department (overseas departments are not included). The raw data contains three recordings per day (i.e., midnight, morning and afternoon), indicating the number of people moving from one department to another at that point of day. We compute a single value for each day and each pair of departments by computing the sum of the three values.
In our study, we assume that the mobility patterns contained in the dataset are correlated with those of the whole population. In fact, ideally, we would like the former to be proportional to the latter (we would like this to hold for some c < 1, mfb=cm where mfb is the amount of mobility contained in our dataset and m is the actual amount of mobility for the same period).
To explore our data, we have created plots for the different departments and an aggregated plot for the whole of France. These plots have revealed some interesting findings. For example, in most cases, we observe that lockdowns have a significant impact on population mobility between departments. This can be seen in the following Figure which illustrates the mobility within departments and across departments in France as well as the number of reported cases with respect to time.
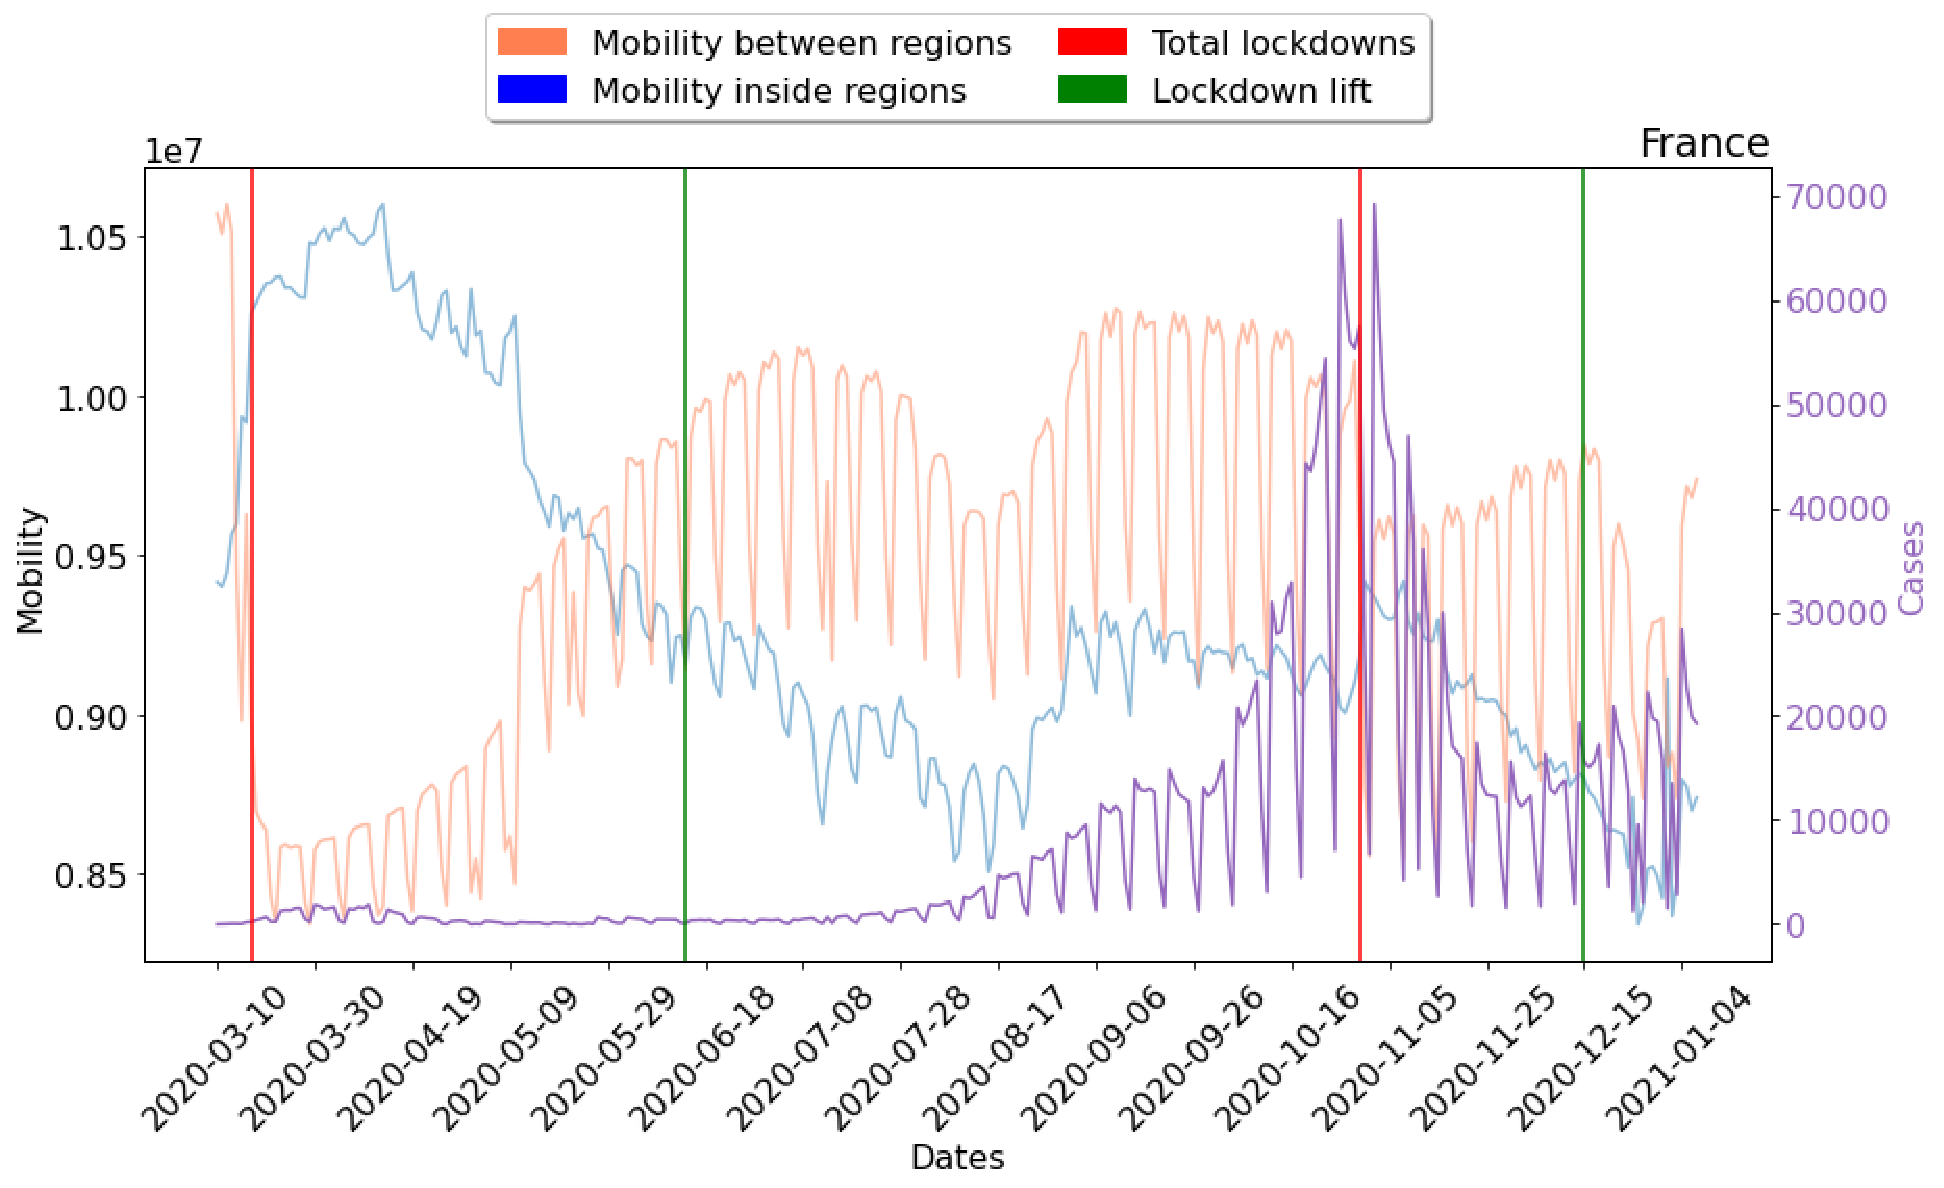
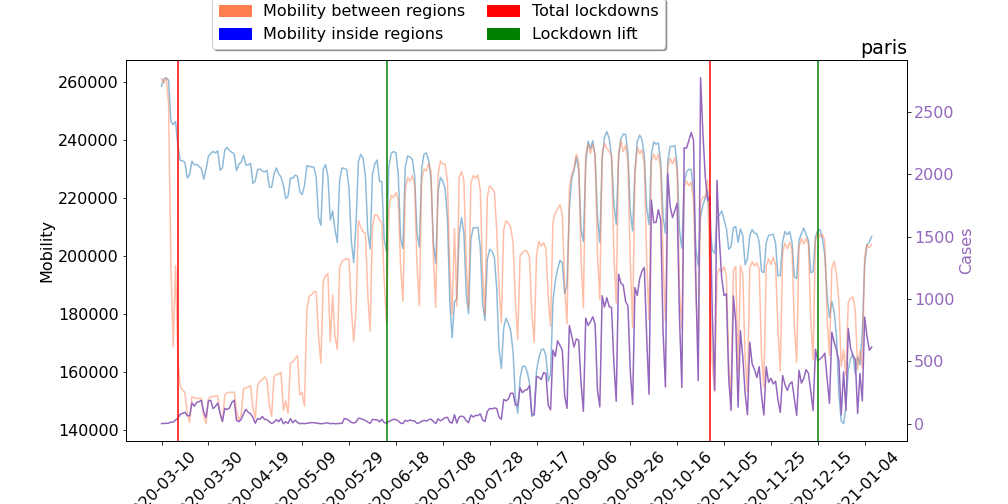
The red and green vertical lines indicate the start and end of the two lockdowns that were imposed by the French government. For instance, it can be seen that there was a 20% decrease in population mobility between departments when the first lockdown was introduced. In some regions, such as in Paris shown in the Figure below, mobility from and towards other departments was decreased even further due to the imposed restrictions. In the case of Paris, we observe a decrease greater than 40%.
Another interesting finding is that beginning from August 2020, the number of confirmed cases seems to be very correlated with population mobility. From August 2020, both mobility between departments and mobility within departments gradually increase and we notice a similar increase in the number of confirmed cases. At the end of October 2020, new restrictions are imposed by the government which leads to a decrease in population mobility and also in the number of cases.
The second lockdown that was imposed by the government seems to be less strict than the first one since the decrease in mobility between departments is not that large as in the case of the first lockdown.
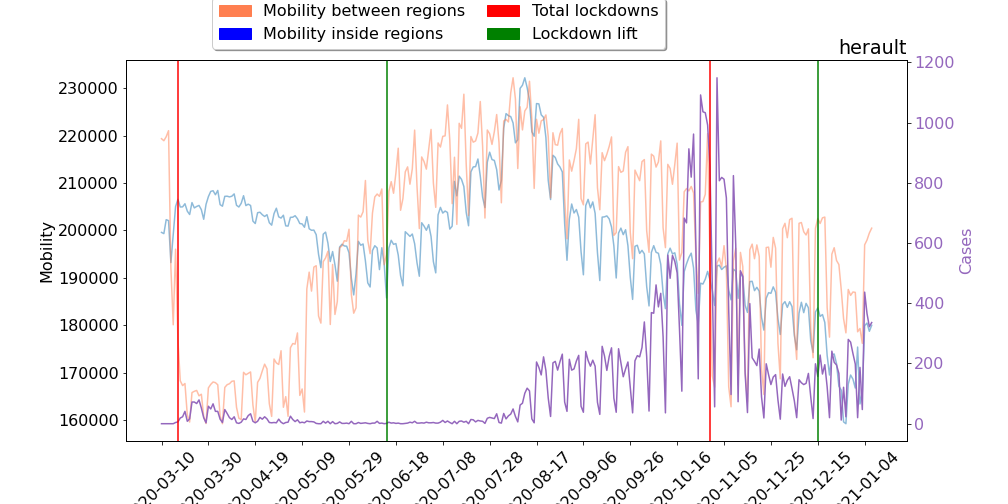
With regards to the mobility within departments, we observe that it achieves its minimum values in mid-August 2020 and also at the end of December 2020 and the first days of January 2021. Both these time intervals correspond to periods where people usually are on holiday (summer and Christmas vacation). Thus, the decrease in mobility could be due to the fact that they did not go to work. Interestingly, this pattern is not ubiquitous in all departments. For instance, the following Figure shows the mobility patterns extracted for the Hérault department. Herault is bordered to the south by the Mediterranean sea, and is a very popular tourist destination. Montpellier is the major city of this department. We can see that in mid-August, both types of mobility take very large values, the largest within our time-span of interest.
On the other hand, the Isère department contains more mountainous areas and it also includes a part of the French Alps. Thus, as we can see in the following Figure, in the summer the mobility within that region decreased a lot.
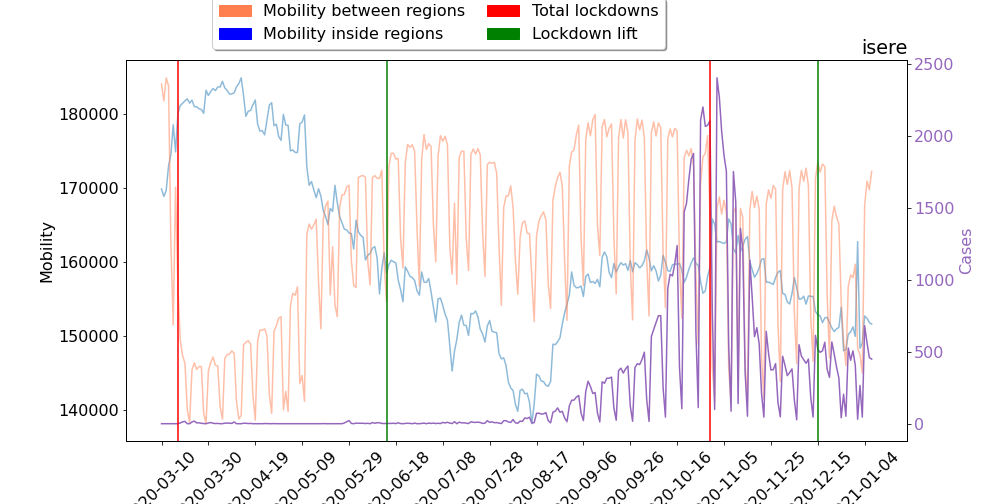
It is thus clear that many people decided to travel or go on holiday even though the pandemic had severely affected France at that point. The effects of summer vacation on disease spread are quite obvious since from the end of the summer, the number of confirmed cases increased significantly. Furthermore, we can see that the lockdown imposed in October 2020 was quite effective. Specifically, the number of confirmed cases was decreased a lot a fews weeks after the lockdown was announced by the government.
With regards to the recovery of population mobility, we observe that mobility between regions starts to recover some weeks after the first lockdown was initiated even if the lockdown had not been lifted yet. In the first weeks of the summer, mobility between departments had almost reached its pre-covid levels. On the other hand, mobility within departments kept decreasing till the end of the summer and then started increasing, but never reached its initial levels.