Having somewhat advanced on the topic of movement previously, with the user defined path, the question of realism came to be more pressing. I thus set out to find out what made the movement of animals in real life “organic”.
After talking about that with my supervisors, the idea that the orientation of animals created some randomness, and thus some life, came up. So, as a first experiment, we decided to analyze the data from videos, to find out where the variations in orientation is the greatest.
To help us in our endeavor, we have access to a configuration space, a set of previously collected data, harvested by analyzing footage of herd movements. In particular, it contains information about speed, that we will use as a basis in this step.
Since the data has information about the velocity of sheep from a video, as a two dimensional vector, we already have information about the orientation of animals at every frame. Nonetheless, as the vectors contain a magnitude on top of the orientation, and we don’t need this magnitude, let us transform the data.
To exclusively encode orientation, we decide to replace, for all frames, the velocity of every animal detected by the angle the velocity makes with the frame’s average velocity.
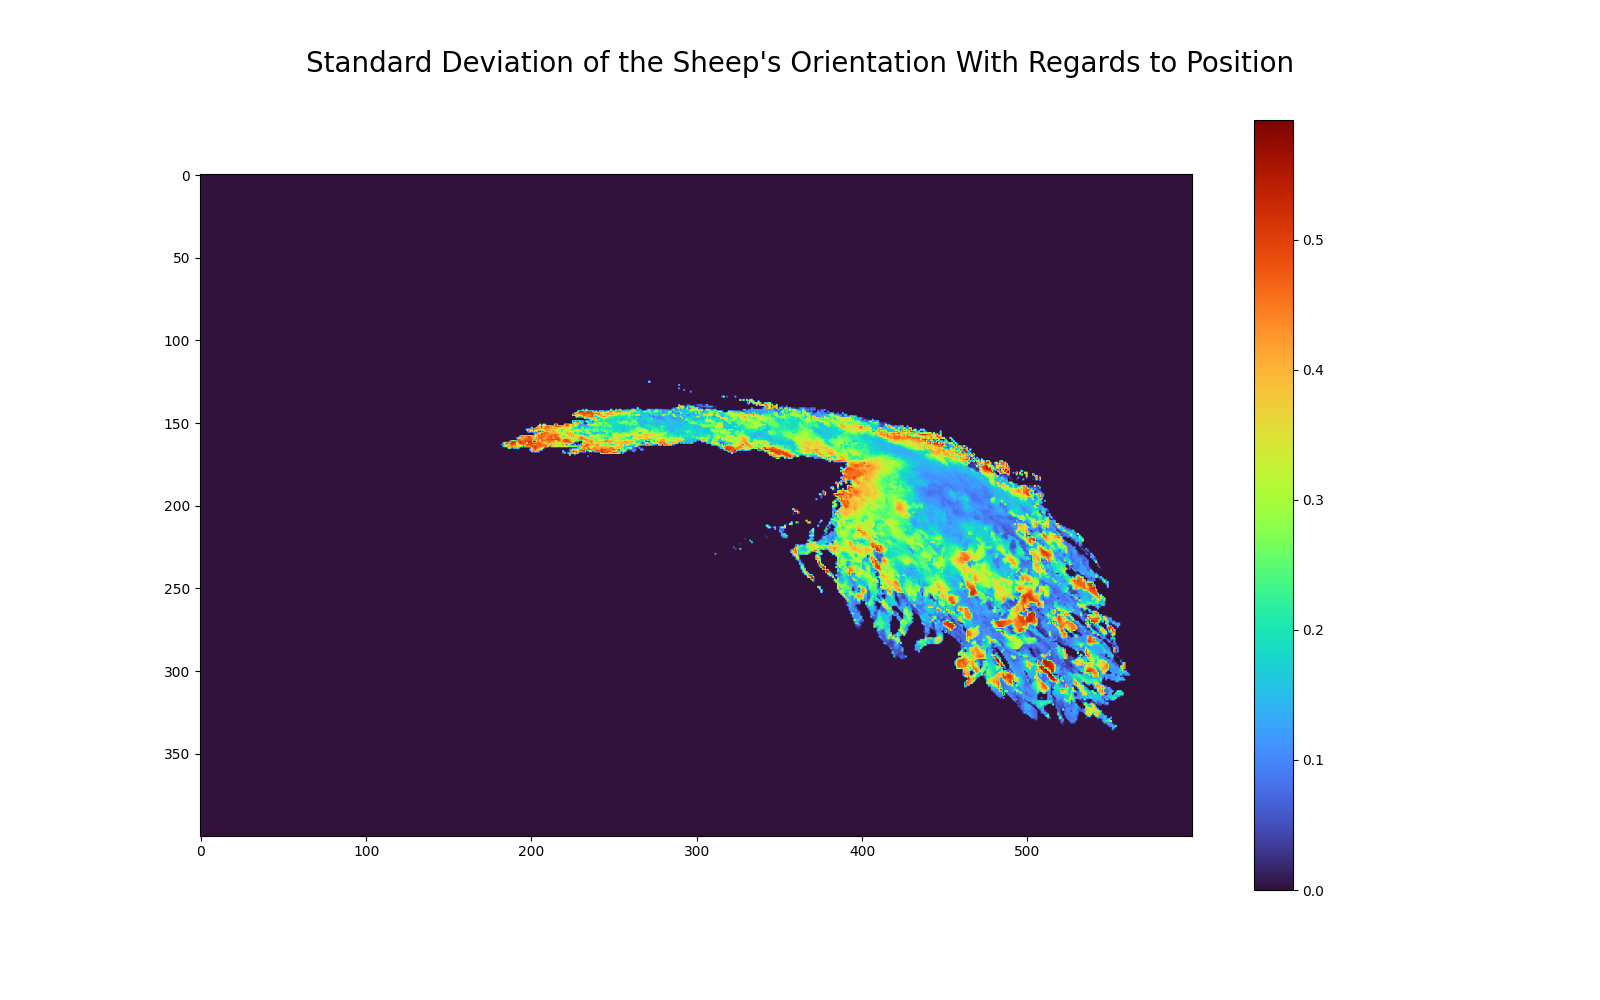
Then, as the information we are looking for is the variation in orientation of the sheep, we first need to extract the velocities from the configuration space and sort them by frame number. We replace every velocity by the angle it makes with it’s frame’s average velocity. Afterwards, we group the angles obtained by position in lists, and, once the lists are constructed, we just need to take the standard deviation of each list, and that gives us the variation in orientation of the animals.
To highlight the color differences in the picture, we apply a sigmoid function and a log scale on the orientation before graphing.
Another idea that came out of talking with my supervisors was an expectation of animals to change their orientation differently depending on how tightly packed they were. We expected animals to change direction more if they were in less densely packed areas, and less in more compact zones.
To verify this hypothesis, I plotted the following graph:
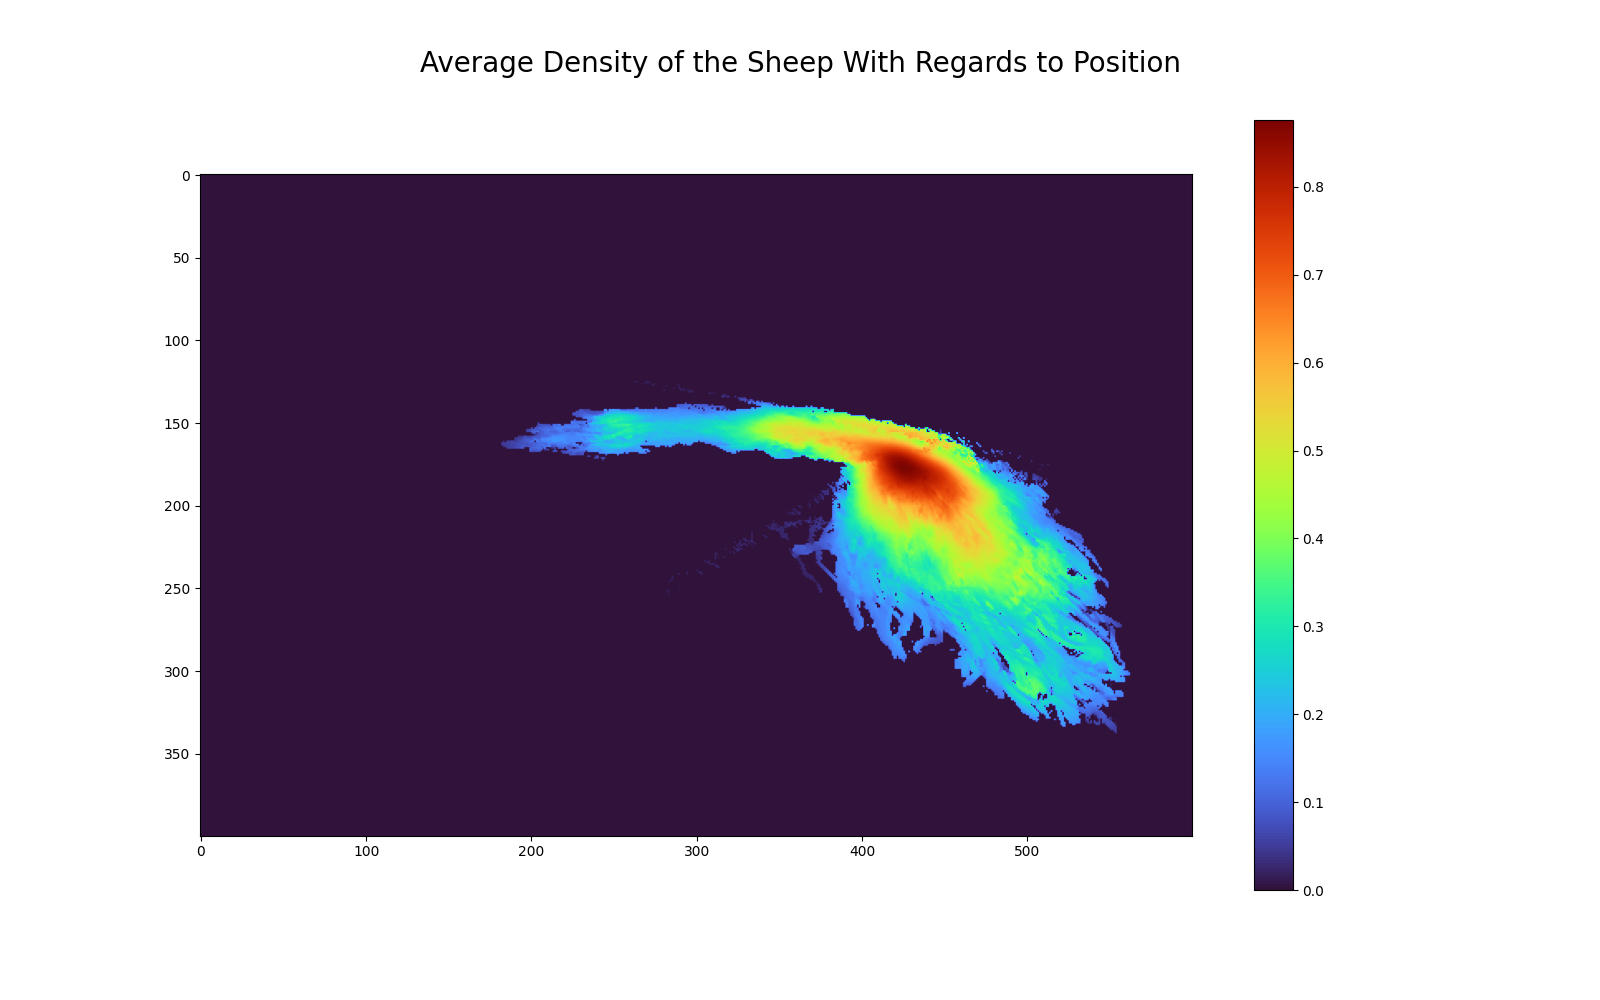
By comparing this graph with the above graph, we can see that the big red spot here corresponds, more or less, to a blue zone in the above graph. Similarly, very blue areas in this graph appear red in the other one.
This left me to intuit that density and change of orientation are inversely correlated. To see if I was right, I plotted the two values against each other.
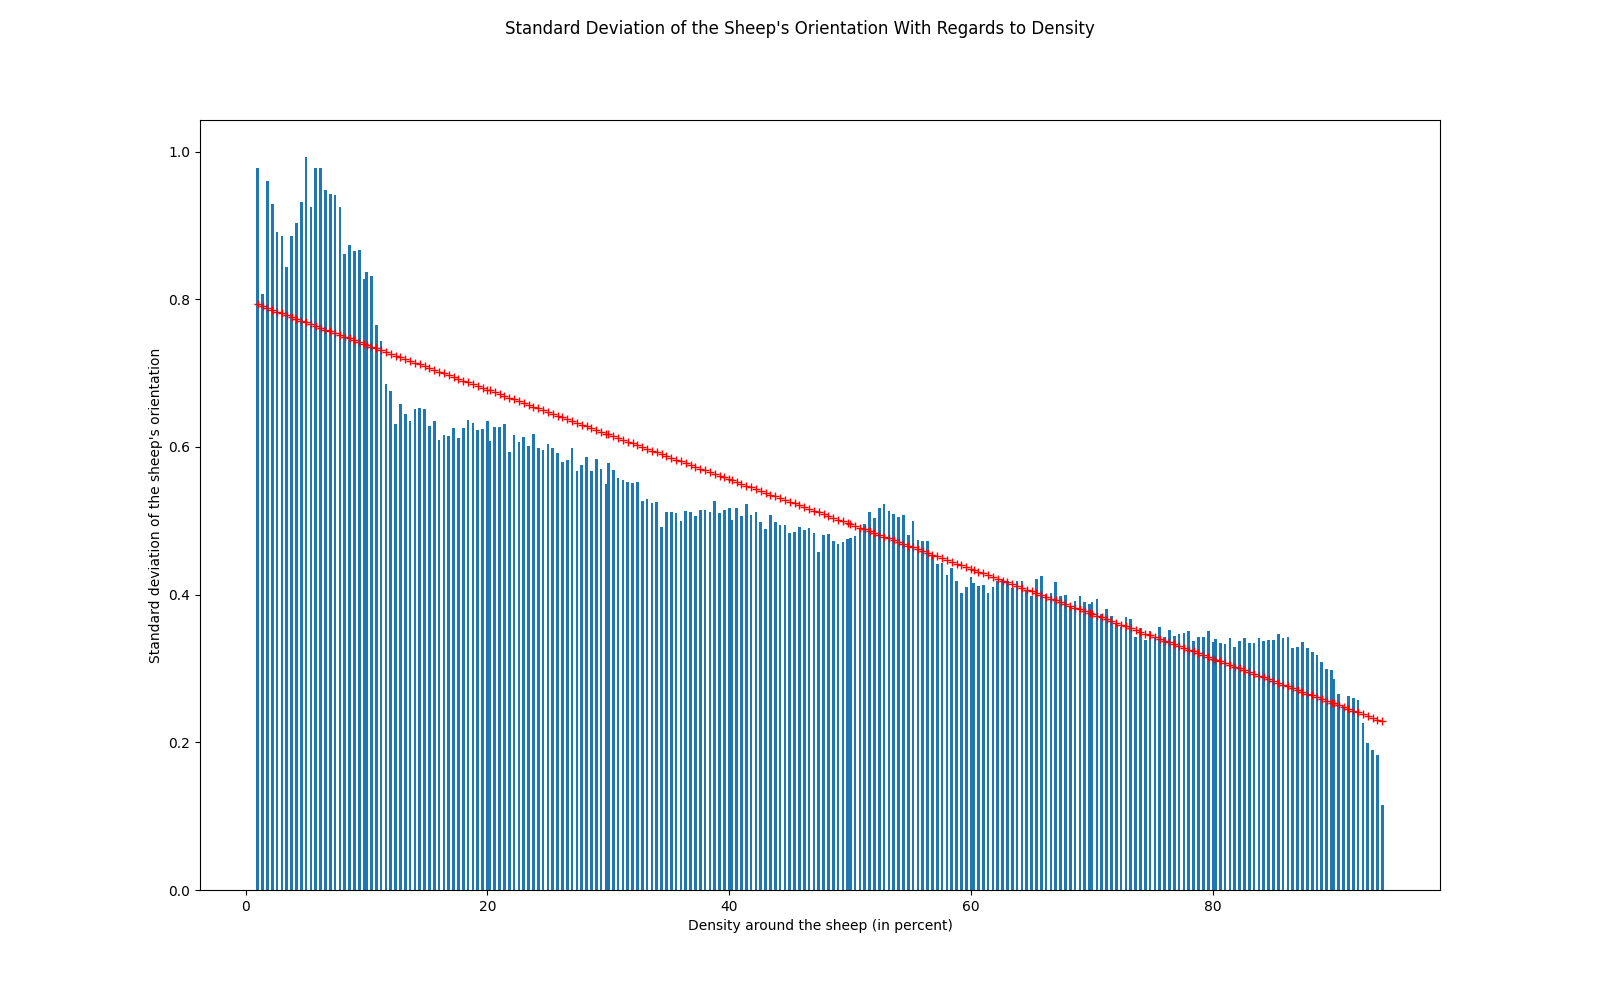
After seeing this graph, we can see that there definitely is an inverse correlation between density and the change of orientation. To extract this correlation for later use in the simulation, I apply a least squares method to obtain the change of orientation function, an affine function that fits the graph.