Next Contents

1  The origins

1.1  Progress graphs

The first ``algebraic topological'' model I am aware of is called progress graph and has appeared in operating systems theory, in particular for describing the problem of ``deadly embrace''1 in ``multiprogramming systems''. Progress graphs are introduced in [Coffman et al., 1971], but attributed there to E. W. Dijkstra. In fact they also appeared slightly earlier (for editorial reasons it seems) in [Shoshani and Coffman, 1970].

The basic idea is to give a description of what can happen when several processes are modifying shared ressources. Given a shared resource a, we see it as its associated semaphore that rules its behaviour with respect to processes. For instance, if a is an ordinary shared variable, it is customary to use its semaphore to ensure that only one process at a time can write on it (this is mutual exclusion). Then, given n deterministic sequential processes Q1,...,Qn, abstracted as a sequence of locks and unlocks on shared objects, Qi=R1 ai1.R2 ai2 ··· Rni aini (Rk being P or V2 ), there is a natural way to understand the possible behaviours of their concurrent execution, by associating to each process a coordinate line in IRn. The state of the system corresponds to a point in IRn, whose ith coordinate describes the state (or ``local time'') of the ith processor.

1.2  Example

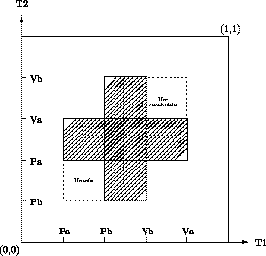
Consider a system with finitely many processes running altogether. We assume that each process starts at (local time) 0 and finishes at (local time) 1; the P and V actions correspond to sequences of real numbers between 0 and 1, which reflect the order of the P's and V's. The initial state is (0,... ,0) and the final state is (1,... ,1). An example consisting of the two processes T1=P a.P b.V b.Va and T2=P b.P a.V a.V b gives rise to the two dimensional progress graph of Figure 1.


Figure 1: Example of a progress graph


Figure 2: The corresponding request graph

The shaded area represents states which are not allowed in any execution path, since they correspond to mutual exclusion. Such states constitute the forbidden area. An execution path is a path from the initial state (0,...,0) to the final state (1,...,1) avoiding the forbidden area and increasing in each coordinate - time cannot run backwards. We call these paths directed paths or dipaths. This entails that paths reaching the states in the dashed square underneath the forbidden region, marked ``unsafe'' are deemed to deadlock, i.e. they cannot possibly reach the allowed terminal state which is (1,1) here. Similarly, by reversing the direction of time, the states in the square above the forbidden region, marked ``unreachable'', cannot be reached from the initial state, which is (0,0) here. Also notice that all terminating paths above the forbidden region are ``equivalent'' in some sense, given that they are all characterized by the fact that T2 gets a and b before T1 (as far as resources are concerned, we call this a schedule). Similarly, all paths below the forbidden region are characterized by the fact that T1 gets a and b before T2 does.

1.3  Directed homotopy

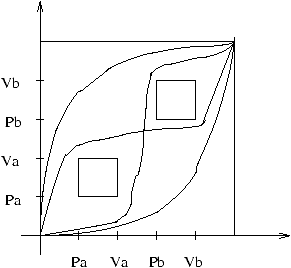
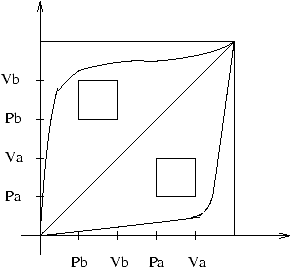
On this picture, one can already recognize many ingredients that are at the center of the main problem of algebraic topology, namely the classification of shapes modulo ``elastic deformation''. As a matter of fact, the actual coordinates that are chosen for representing the times at which Ps and Vs occur are unimportant, and these can be ``stretched'' in any manner, so the properties (deadlocks, schedules etc.) are invariant under some notion of deformation, or homotopy. This is a particular kind of homotopy though, and this will be at the center of many difficulties in later work. We call it (in subsequent work) directed homotopy or dihomotopy in the sense that it should preserve the direction of time. For instance, the two homotopic shapes, all of which have two holes, of Figure 3 and Figure 4 have a different number of dihomotopy classes of dipaths. In Figure 3 there are essentially four dipaths up to dihomotopy (i.e. four schedules corresponding to all possibilities of accesses of resources a and b) whereas in Figure 4, there are essentially three dipaths up to dihomotopy.


Figure 3: The progress graph corresponding to Pa. Va. Pb. Vb | Pa. Va. Pb. Vb


Figure 4: The progress graph corresponding to Pb. Vb. Pa. Va | Pa. Va. Pb. Vb

There is another method to determine deadlocks in such situations, which was of course known long ago and was entirely graph-theoretic, known as the request graph. Figure 2 depicts the request graph corresponding to the progress graph of Figure 1. Nodes of this graph are resources of the concurrent system, i.e. here, semaphores. There is an oriented edge from a resource x to a resource y if there is a process which has locked x and needs to lock y at a given time. A sufficient condition for such systems to be deadlock-free is that their corresponding request graphs be acyclic3 . Unfortunately, this is not a necessary condition in general. For instance a request graph cannot capture the notion of n-semaphores, i.e. resources that can be shared by up to n processes but not n+1 (for instance, asynchronous buffers of communication of size n which can be ``written'' on by at most n processes). This in fact really calls for some higher-dimensional versions of graphs.
Starting from progress graphs, the article [Coffman et al., 1971] developed an algorithm in O(n2) (n is the number of tasks) to determine freedom from deadlocks. The notion of unsafe state was also introduced with the hope to determine automatically the right schedulers that would prevent the whole system from running into a deadlock situation. This was limited to binary semaphores only though4 . A fully worked out deadlock detection algorithm on progress graphs (including the determination of the unsafe region) is described in [Carson and Reynolds Jr, 1987] which takes care of this limitation. This was unfortunately not an optimal algorithm.


Next Contents